Help pages
Example: First Hebrew exercise
Example: Second Hebrew exercise
Example: Third Hebrew exercise
Example: Second Greek exercise
Example: Create a simple Hebrew exercise
Example: Create an advanced Hebrew exercise
Example: Create a simple Greek exercise
Example: Create an advanced Greek exercise
How are my students doing?
Andrews University Final Exam: Hebrew I (OTST551)
Andrews University Final Exam: Hebrew II (OTST552)
Andrews University Final Exam: Advanced Hebrew (OTST625)
Andrews University Hebrew Placement Exam
Hebrew Proficiency Exam for OTST Exegesis classes
Andrews University Final Exam: Intermediate Greek (NTST552)
Andrews University Greek Placement Exam
How Are My Students Doing?
Every time students run an exercise, statistics about that exercise is stored in the system. If a student terminates the exercise by pressing “GRADE task”, the results will be available to you if you own the class in which the student is enrolled.
To check the status of your students’ progress, select the menu My Data > Students’ performance. You will then see a page like this:
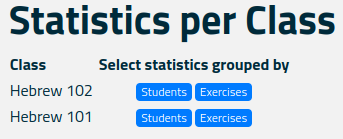
For each class you own, you have two buttons, one labelled “Students” and one labelled “Execises”.
The “Students” Button
If you click the “Students” button, you will see a bar graph similar to this one:
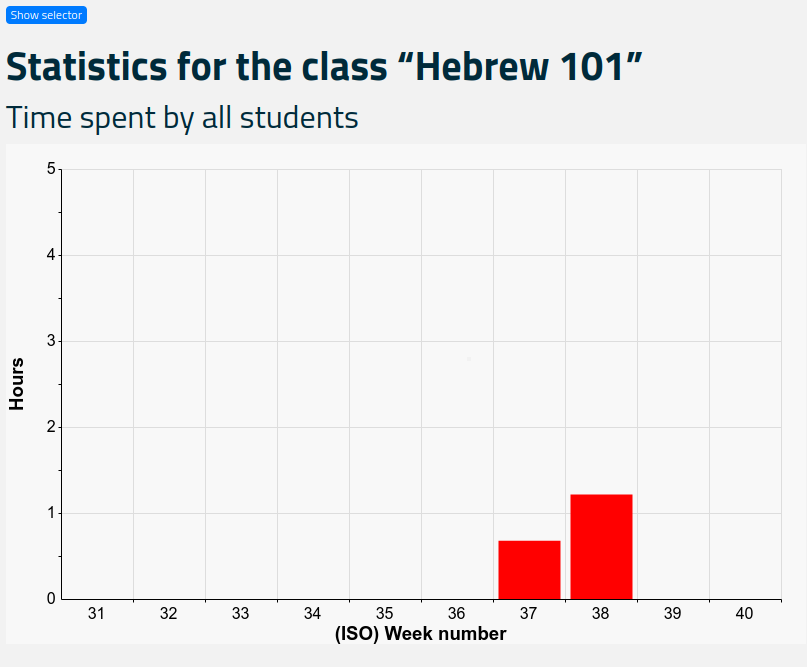
The horizontal axis is the ISO week number, and the vertical axis shows the total number of hours spent on exercises during each week by students in the selected class.
The blue “Show selector” button at the top allows you to specify the date range you are interested in. A maximum of 26 weeks (6 months) can be shown.
Below this graph, another graph shows the time spent by each student. It may look like this:
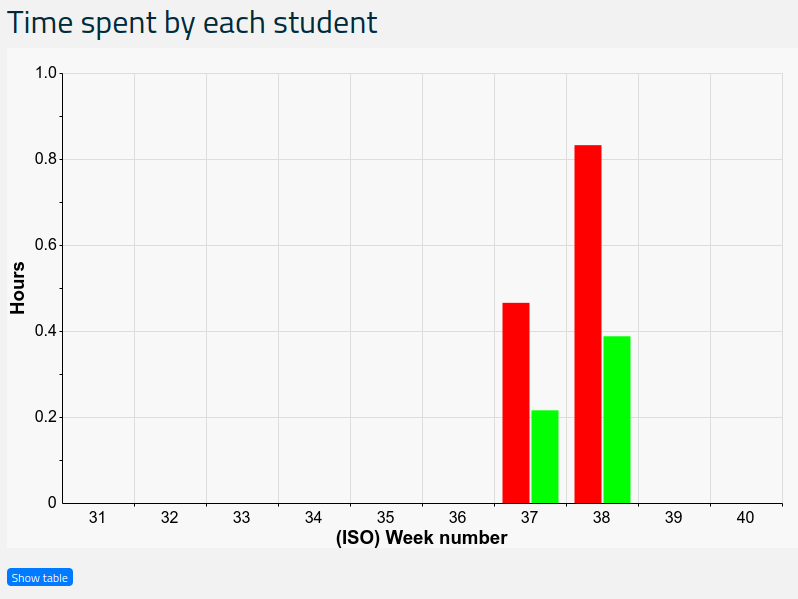
In this case there are two students in the class. Each color represents a student, and you can see the meaning of the colors in the “Students” box at the left top of your screen:
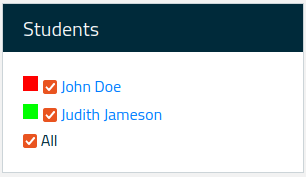
Here you see that the red color corresponds to John Doe and the green color to Judith Jameson. You can use the check boxes to remove information about individual students from the graph. Also, you can click a student’s name; this will bring up a page showing that student’s progress similar to what the student can see themselves under the menu My Data > My performance.
The blue “Show table” button below the bar graph allows you to see the data in the form of a table.
The “Exercises” Button
If you click the “Exercises” button, you will see a dialog similar to this one:
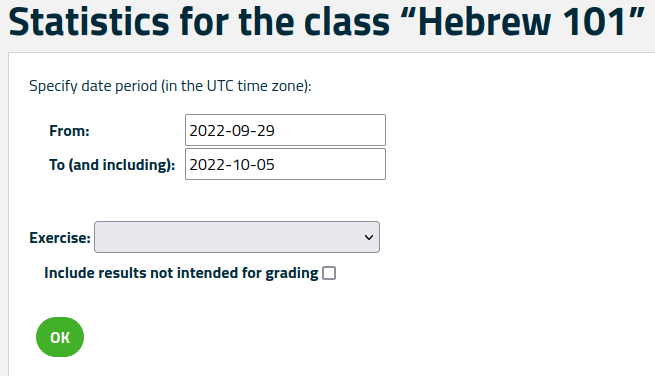
Here you must provide a date range (at most 26 weeks or 6 months). Select an exercise in the “Exercise” drop-down menu, and indicate if exercises marked as not intended for grading should be included.
You will then see graphs similar to the ones students can see for their own exercises, except that here each student’s data is included:
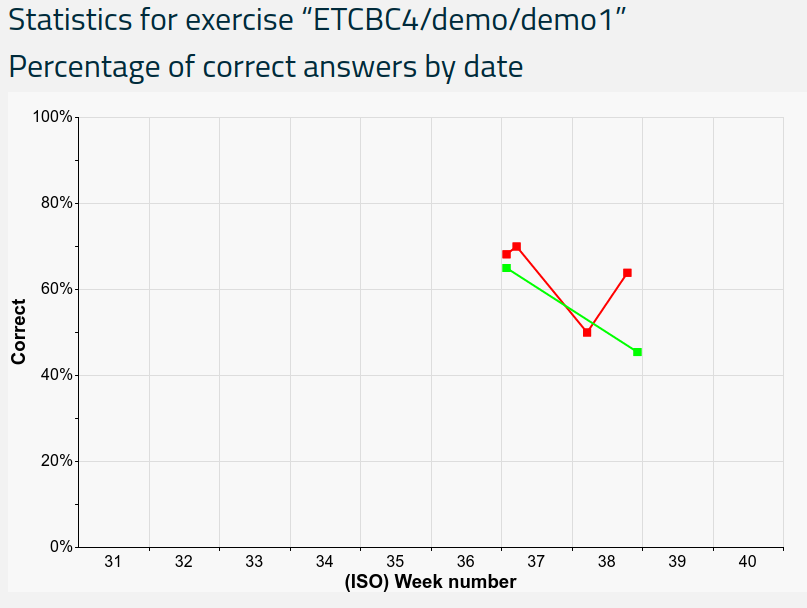
Just like students can do, you can hover your mouse over data points to get more information. And just as mentioned above, you can remove information about each student by changing the checkboxes int the “Student” box at the top left of your screen.