Help pages
Example: First Hebrew exercise
Example: Second Hebrew exercise
Example: Third Hebrew exercise
Example: Second Greek exercise
Answering various types of questions
How am I doing?
Example: Create a simple Hebrew exercise
Example: Create an advanced Hebrew exercise
Example: Create a simple Greek exercise
Andrews University Final Exam: Hebrew I (OTST551)
Andrews University Final Exam: Hebrew II (OTST552)
Andrews University Final Exam: Advanced Hebrew (OTST625)
Andrews University Hebrew Placement Exam
Hebrew Proficiency Exam for OTST Exegesis classes
Andrews University Final Exam: Intermediate Greek (NTST552)
Andrews University Greek Placement Exam
How Am I Doing?
Every time you run an exercise, statistics about that exercise are stored in the system. If you terminated the exercise by pressing “GRADE task”, your results will be available to your teacher for use in grading your performance. If you terminated the exercise by pressing “SAVE outcome”, your results will not be used for grading your performance, and your results will only be available to your teacher if you granted the teacher access when you enrolled in the relevant class.
You can always check the status of your own progress. If you select the menu My Data > My performance you will see a bar graph similar to this one:
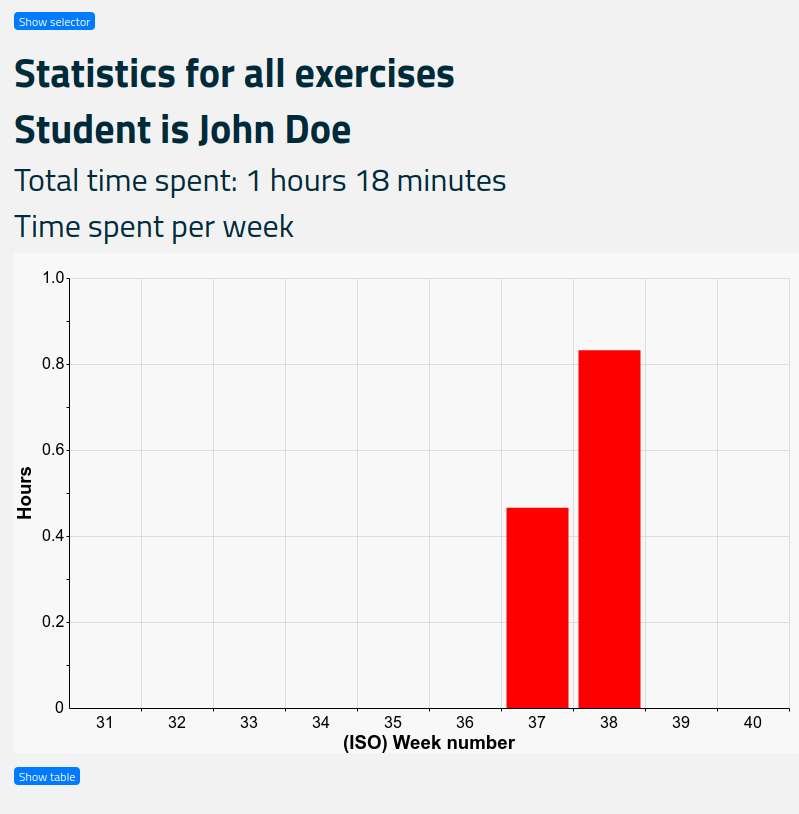
The horizontal axis is the ISO week number, and the vertical axis shows the number of hours you spent on exercises during each week.
The blue “Show selector” button at the top allows you to specify the date range you are interested in. A maximum of 26 weeks (6 months) can be shown. You can also limit the data to exercises in a particular class in which you are enrolled.
The blue “Show table” button below the bar graph allows you to see the data in the form of a table.
Below this graph, another graph shows the time spent on each exercise. It may look like this:
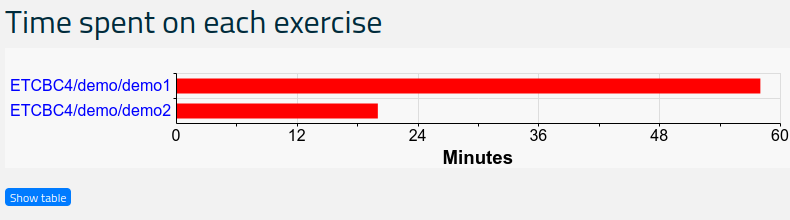
In this example, you have spent almost 60 minutes on the exercise ETCBC4/demo/demo1 and 20 minutes on the exercise ETCBC4/demo/demo2. The exercise names are hyperlinks, and clicking a name brings up details about that exercise. For example, clicking “ETCBC4/demo/demo1” may display this graph:
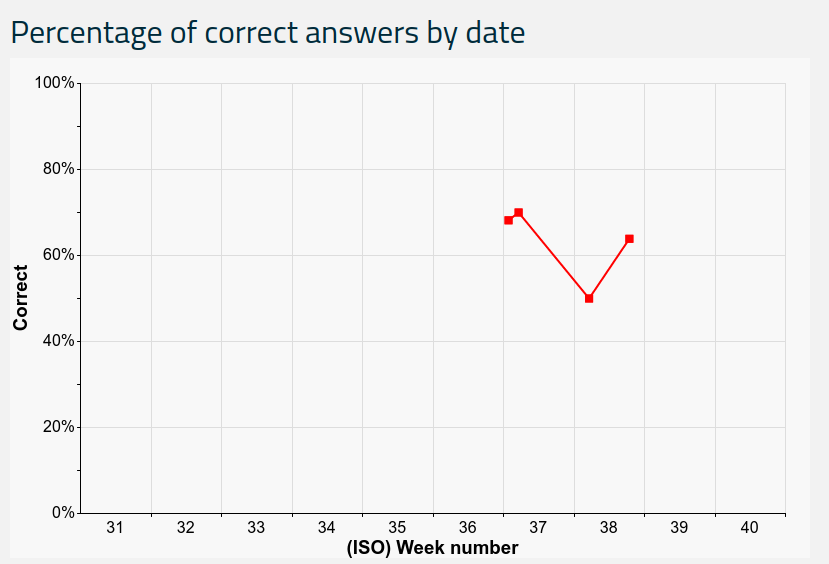
This table shows how many correct answers you had each day you ran the exercise. If you use your mouse to point to a data point, the date and answer speed will be displayed:
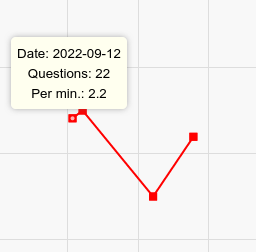
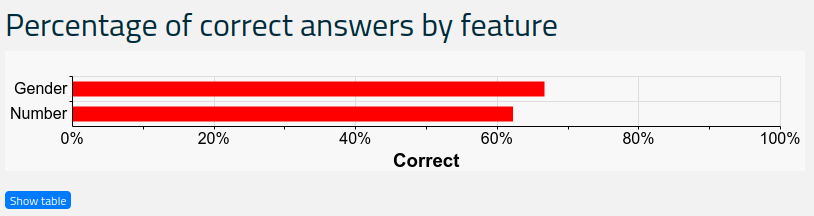
Below this graph, another graph displays your answer speed each day, and hovering your mouse over a data point shows the percentage of correct answers. A final graph shows a total of how well you answered each of the request features: